
Call PCAP
Troubleshooting is an unpleasant necessity when setting up and operating a PBX in the cloud or on customer premises. Our approach is to avoid trouble as much as possible by design; for example by providing a NAT traversal solution for SIP endpoints. However when it comes to trouble it is important to have the necessary tools to find out what is going on quickly.
Troubleshooting SIP registrations is relatively simple. By checking out the SIP packets, most cases can be closed quickly. We added registration stability reporting practically from version 1; when an endpoint losses it registration or changes its registration address, the administrator gets an email. This makes it easy to locate buggy firewalls and unstable internet connections. We have now even the overview on how phones are registered in a domain, which shows very quickly where the problems are.
We have also added more and more features for troubleshooting the provisioning process. The PBX writes the generated files into the “generated” folder into the file system. Here the administrator can take a look at what the phone has received for provisioning. The latest addition is a history file that shows when which file has been generated.
But the most recent addition is the troubleshooting tool for calls. We have seen an increased need to troubleshoot media-related problems with the PBX. This is probably because more and more deployments are happening out there in the “cloud”, where quality of service is not the same like in the LAN with a PSTN gateway. We have RTCP-XR reports for many years. Those reports find their way into the MOS graph. However they provide only a superficial overview on how users may perceive the overall quality. But in real PBX operations life, the RTCP-XR reports are not enough.
Our old approach to run Wireshark on the system was a good starting point. However when you have hosted environments with hundreds of registrations and lots of calls, those PCAP files can get huge. What is even worse, finding the right call is like looking for the needle in the haystack.
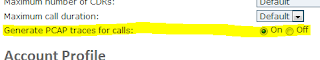
In most cases, complaints about call quality affect a certain extension or trunk. Therefore, the PBX records the PCAP for calls based on the trunk or based on an extension. Each calls generates a separate PCAP file; if there are multiple calls that match the capturing criteria, the PBX will write several files accordingly.
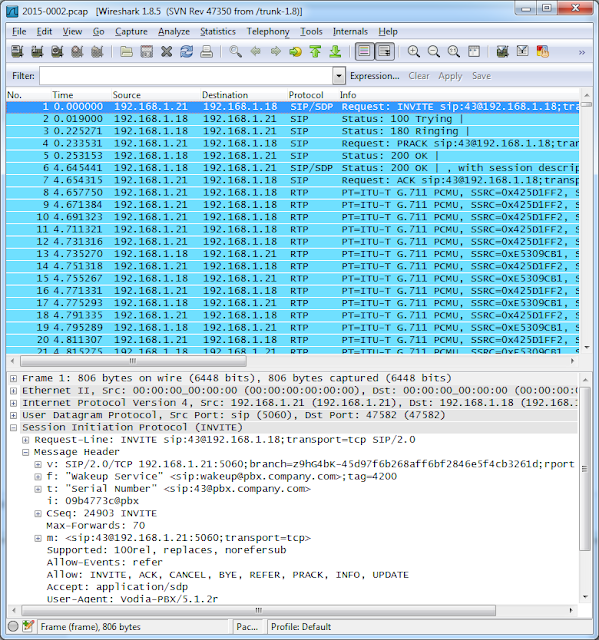
And while we were on it, we also addressed another problem. Recording TLS and SRTP encrypted traffic with Wireshark is difficult by nature. Because the PBX has the security context for both the signaling and the media, it first decodes the traffic before sending it to the PCAP subsystem. Don’t be surprised if you find a SIP packet that was sent over TLS as a UDP packet in the trace. It is just to keep you informed what has been send and received at what time. The RTP time-stamps are critical for the PCAP. In Linux, we are able to retrieve those time-stamps from the networking subsystem for received packets. For sent packets the PBX takes the current time-stamp and uses that to add the packet to the PCAP file. This must also be done for the other operating systems that do not support retrieving time-stamps from the network subsystem (e.g. Windows). However the time-stamps should be good enough to troubleshoot visible and audible problems in the media stream.
The files are put into a directory that depends on the day. Inside that directory the file name contains the time and the call port number, so that it can be easily correlated to the other logs in the system.
The feature is available for all operating systems. This is another distinction from previous releases where PCAP was only available for Linux systems. Now it is possible to generate SIP call traces for Windows, MAC, FreeBSD and of course the Linux flavors.
The new feature will be available in 5.1.3 with previews available in 5.1.2r.