How to Connect Prometheus with the Vodia PBX
How to Connect Prometheus with Vodia PBX
Prometheus is an open-source monitoring and alerting toolkit that is part of the Cloud Native Computing Foundation. By integrating it with Vodia PBX, you can effectively monitor and manage your phone system's performance. Here’s how to get started:
Step 1: Create an API Account on Vodia PBX
To allow Prometheus to access Vodia PBX data, you need to create an API account. Follow these steps:
-
Log in to Vodia PBX as an Administrator:
- Navigate to the system level where you can manage user accounts.
-
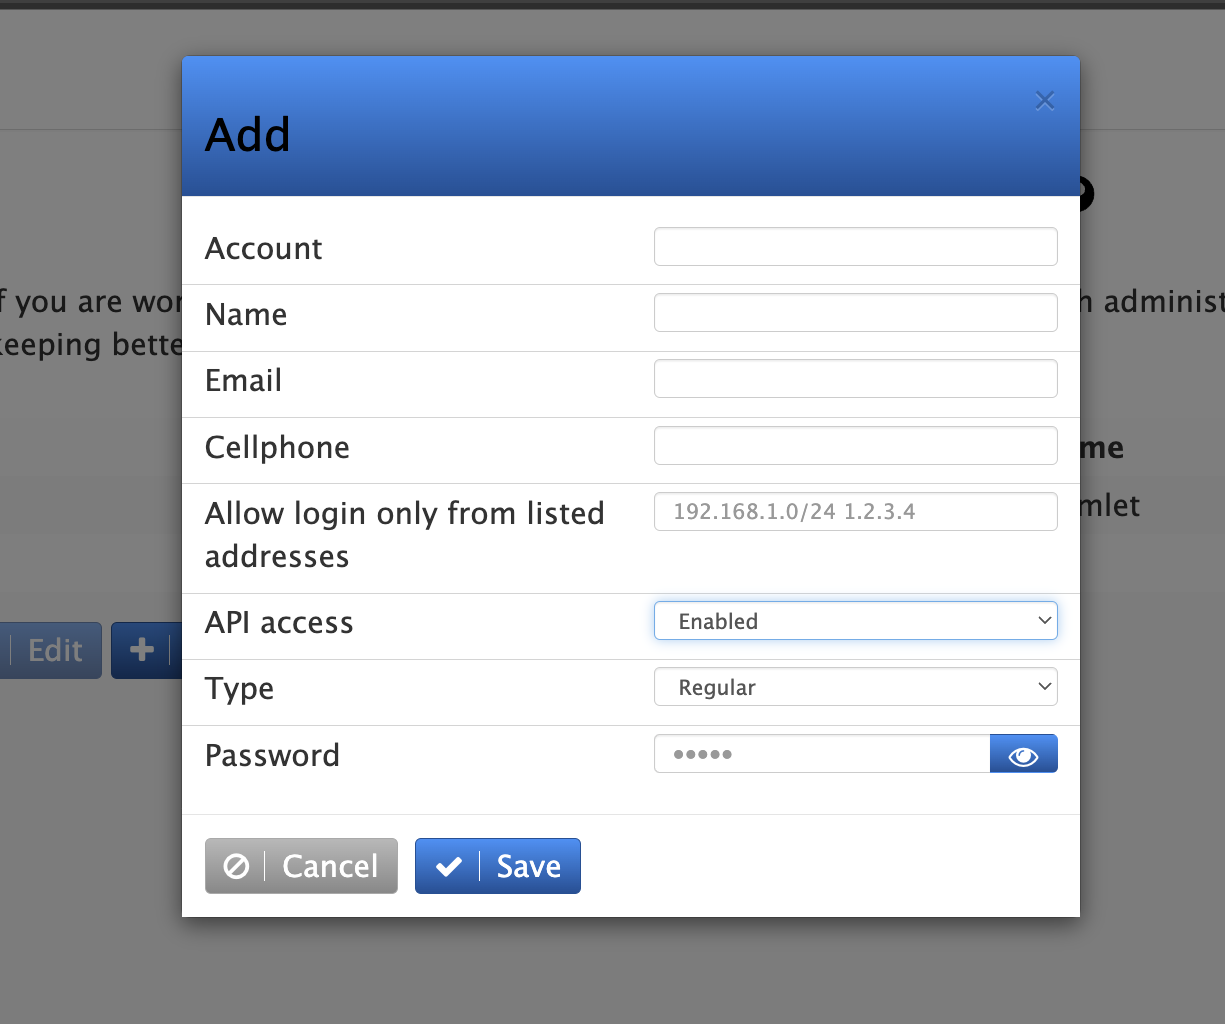
Create a New User Account for API Access:
- Go to the Administrator section.
- Create a new account with the following details:
- Account: Choose a user name.
- API Access: Enable API access.
- Type: Set the account type to Regular.
- Password: Set a strong, secret password.
-
Save the Configuration:
- Save the user account configuration.
- Keep the username and password handy, as you will need them for Prometheus to access Vodia PBX data.
Installing Prometheus on Digital Ocean
https://marketplace.digitalocean.com/apps/prometheus
Once your server is set up, you can access the Prometheus user interface by going to:
http://your_server_ip:9090/
Setting up the .yml file
By default, Prometheus is set up to monitor itself and Node Exporter. To monitor more systems, you need to update the configuration file located at: /etc/prometheus/prometheus.yml
3 things need to be changed in the Prometheus .yml file config file
- targets: ['123.vodia.com'] Here is where you will set the target in this case it will be your PBX DNS name
username: 'prometheus'
password: 'prometheus'
Note: Do not remove the ' ' and [ ] in the config file leave it as is and change the value
Once you have edited the config file, you can modify the prometheus.yml using nano or any edit you desire by just copy-pasting the config or simply creating a new .yml file and renaming the old one.
the restart the service by, sudo systemctl restart prometheus
How to use Vodia API
To learn more about Vodia API please visit us here https://api.vodia.com/#f3d2b273-75f7-4876-be45-d34858664fed
Check the Prometheus and click on System Stats, this will show all of the available APIs for Prometheus, and you will see an Example Response, click on "view more" and it should show something like this
I have bolded all of the stats you can use as an examples, there's no need to copy the whole thing
# pbxctrl 69.3.2.beta
# HELP system_cpu_srv_max Peak usage of the CPU
# TYPE system_cpu_srv_max gauge
system_cpu_srv_max 0 1719852690061
# HELP system_cpu_srv_avg Average Load
# TYPE system_cpu_srv_avg gauge
system_cpu_srv_avg 0 1719852690061
# HELP system_cpu_ctrl_max Peak usage of the CPU
# TYPE system_cpu_ctrl_max gauge
system_cpu_ctrl_max 25 1719852690061
# HELP system_cpu_ctrl_avg Peak usage of the CPU
# TYPE system_cpu_ctrl_avg gauge
system_cpu_ctrl_avg 2 1719852690061
# HELP system_memory_all Total
# TYPE system_memory_all gauge
system_memory_all 172928 1719852690061
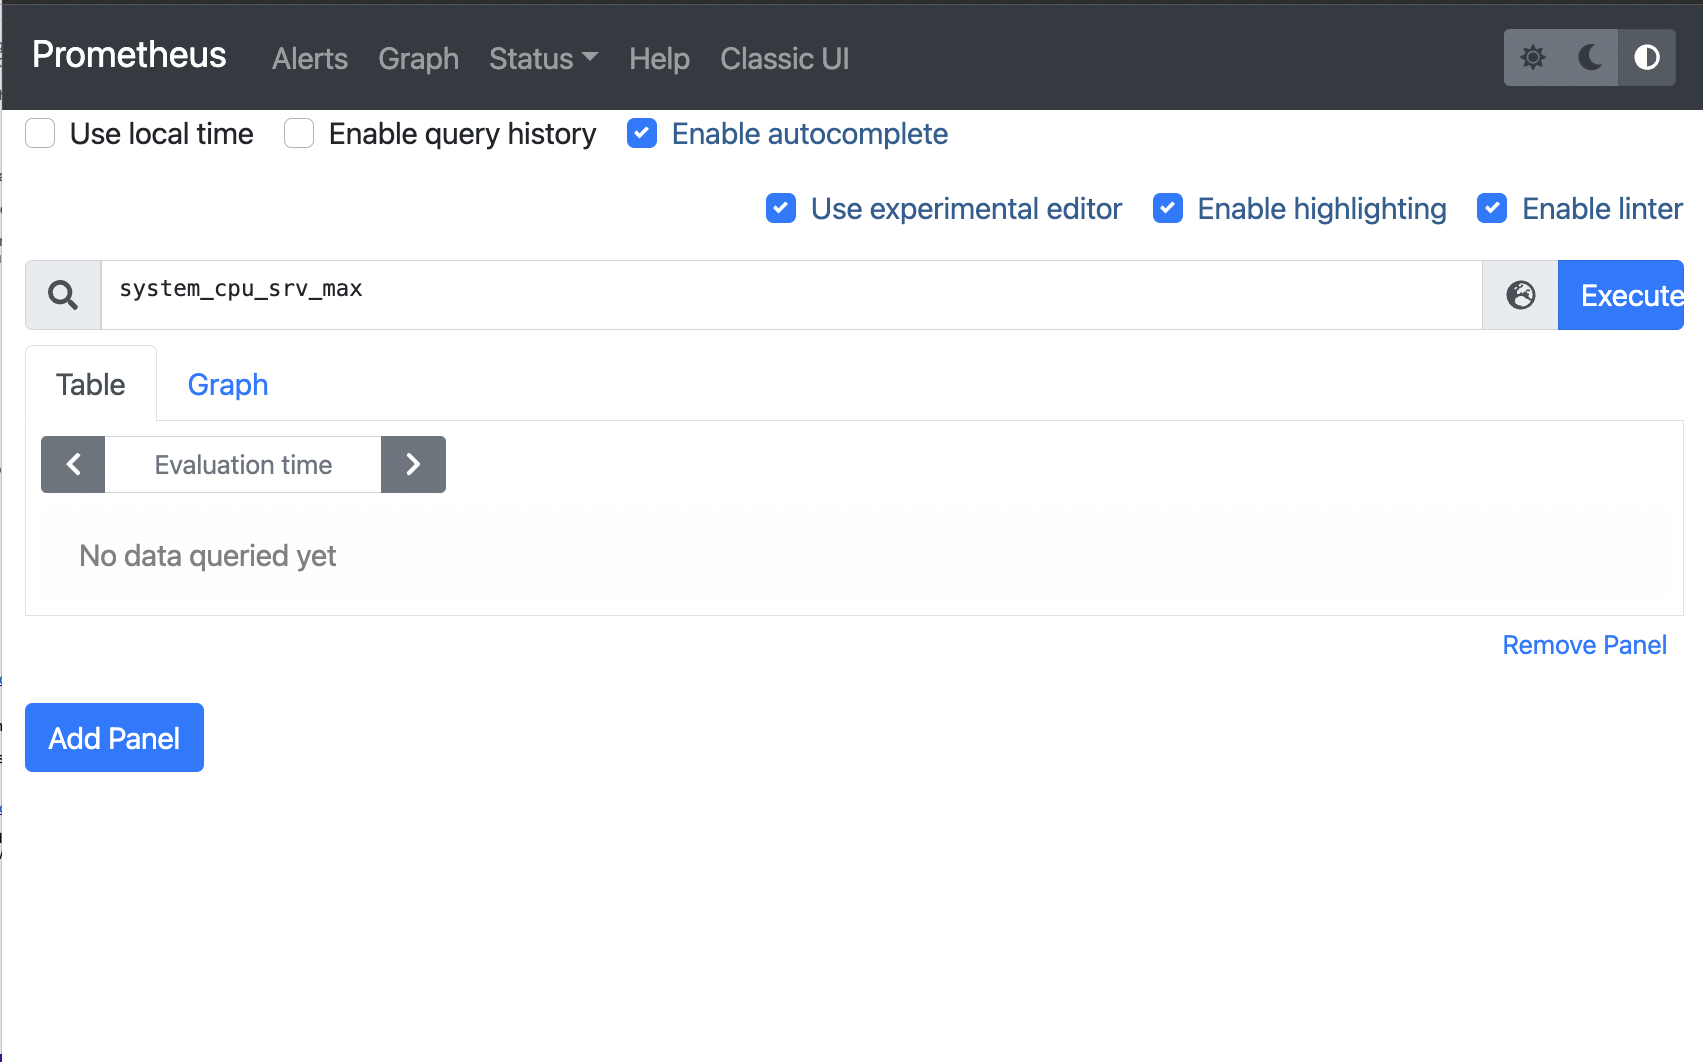
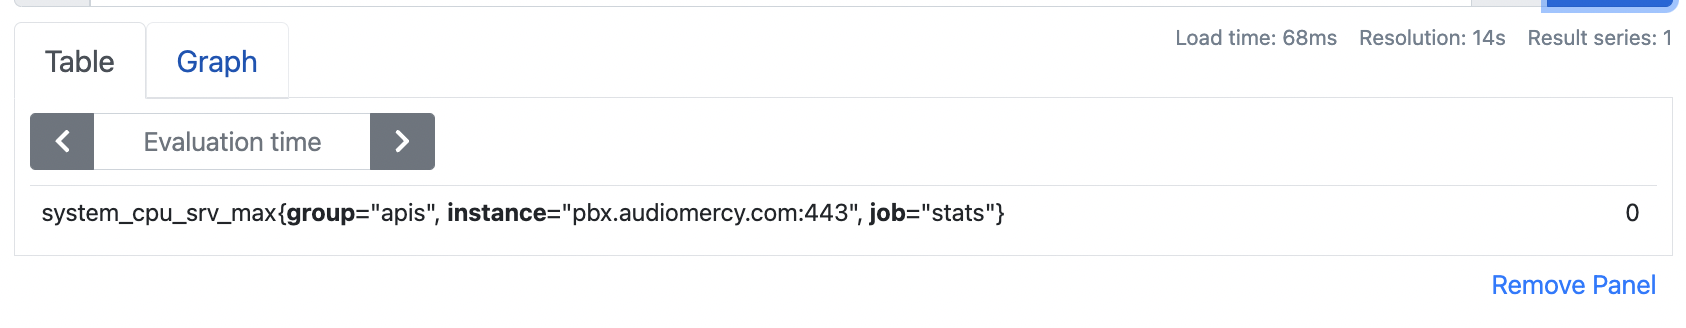
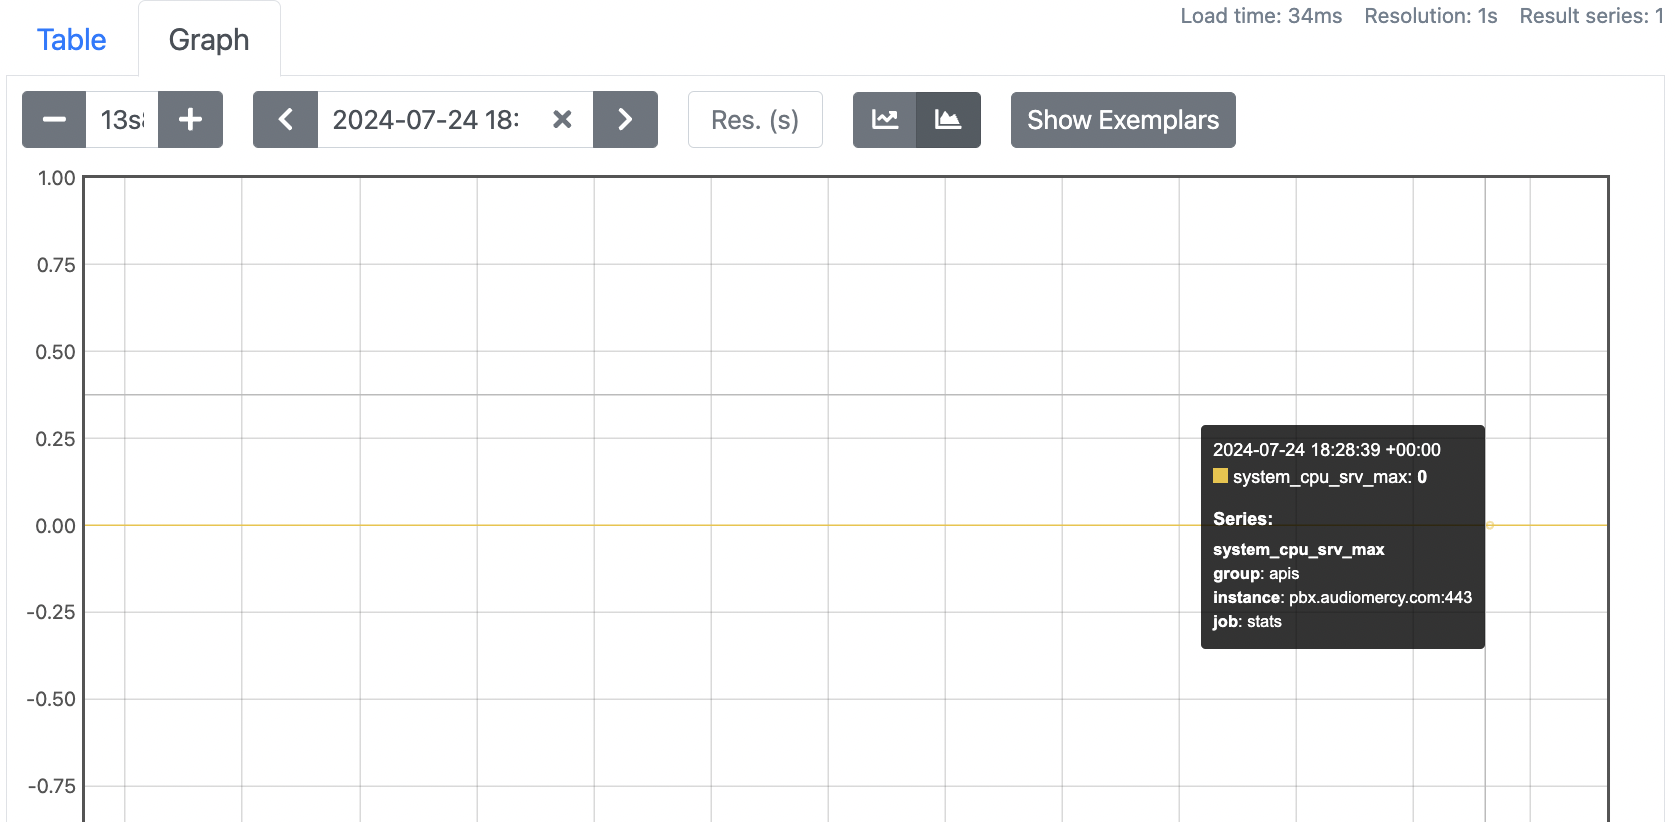
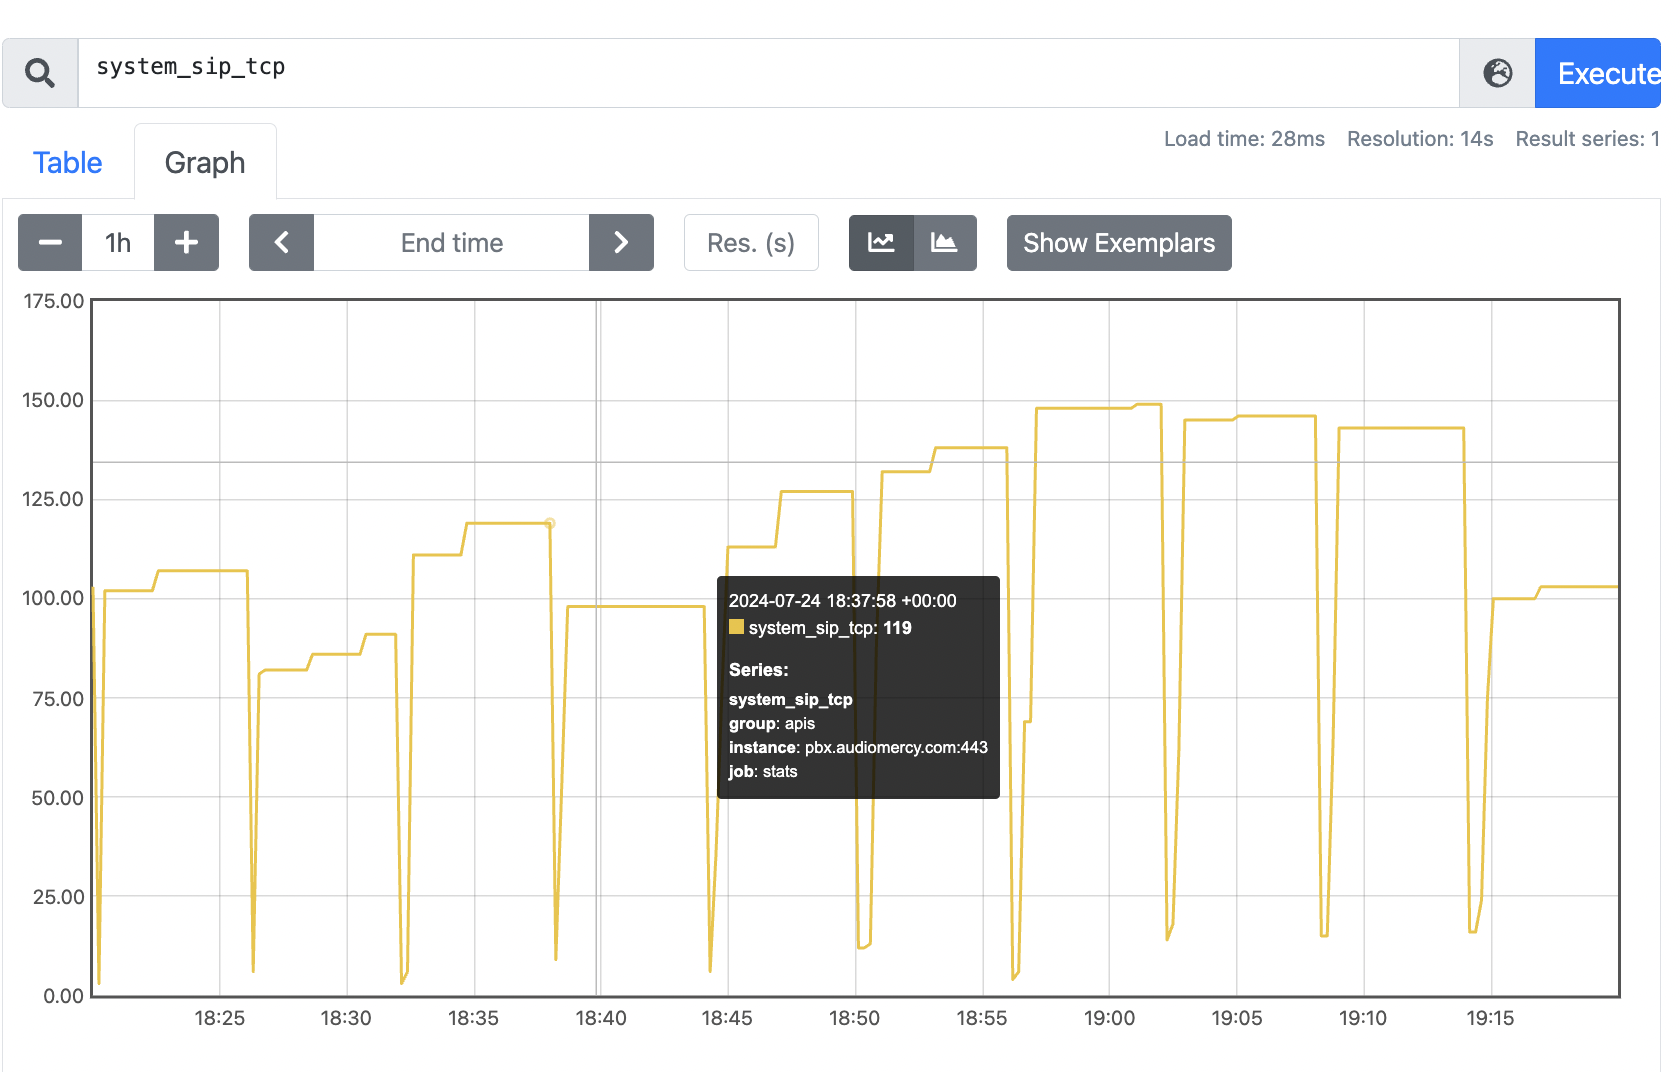
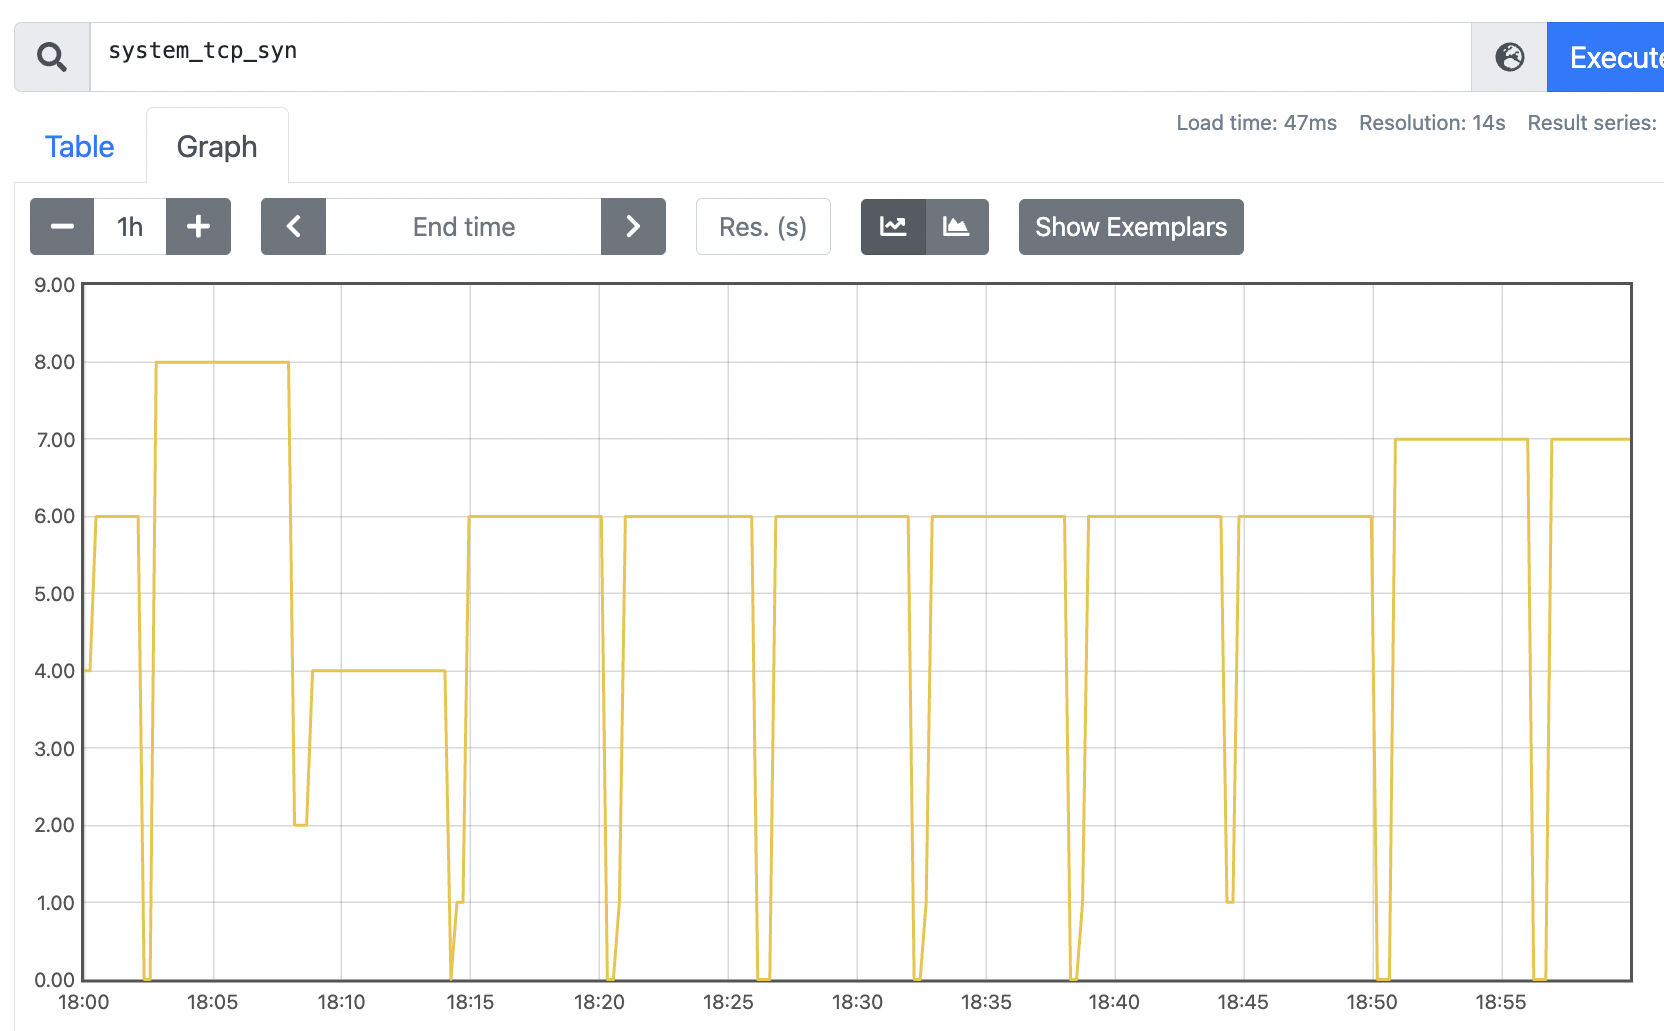
Creating a stat panel on Prometheus
Click add panel and enter the Vodia API cmd in this case system_cpu_srv_max then press execute, you can create many panels to monitor the PBX.